
เปรียบเทียบราคาซื้อ–ขาย BTC ในไทย
- Bitkubกำลังโหลดราคา
- Binance THกำลังโหลดราคา
- Upbit Thailandกำลังโหลดราคา
บาทต่อ 1 BTC · ก่อนค่าธรรมเนียม · ราคาซื้อขายจริงขึ้นกับปริมาณที่มีในกระดาน
กำลังโหลดราคา
สัญญาณเทคนิคบิทคอยน์Bitcoin technical signals
BTC/THB จาก Binance TH · คำนวณจากแท่งที่ปิดแล้วBinance TH BTC/THB · Based on closed candles
| กรอบกราฟChart timeframe | EMA 20/50 | RSI 14 | MACD | แนวโน้มTrend | ย้อนหลัง 20 สัญญาณLast 20 signals |
|---|---|---|---|---|---|
| 1 นาที1m | — | — | — | กำลังโหลดLoading | — |
| 5 นาที5m | — | — | — | กำลังโหลดLoading | — |
| 15 นาที15m | — | — | — | กำลังโหลดLoading | — |
| 30 นาที30m | — | — | — | กำลังโหลดLoading | — |
| 1 ชั่วโมง1h | — | — | — | กำลังโหลดLoading | — |
| 1 วัน1d | — | — | — | กำลังโหลดLoading | — |
| 1 สัปดาห์1w | — | — | — | กำลังโหลดLoading | — |
ย้อนหลังจำลองจากแท่งปิด Binance TH BTC/THB วัดทิศทางจากราคาปิดแท่งถัดไป กดจำนวนผลเพื่อดูแต่ละครั้งHistorical simulation from Binance TH BTC/THB closed candles. Checks the direction at the next candle close. Open the counts for individual results.
ดูอินดิเคเตอร์และวิธีอ่านShow indicators and methodology
EMA 20 เทียบ EMA 50, RSI สูงกว่า 55 หรือต่ำกว่า 45 และ MACD histogram เหนือหรือต่ำกว่าศูนย์ ให้คะแนนขาขึ้นหรือขาลงอย่างละหนึ่งเสียง เมื่ออย่างน้อยสองเสียงไปทางเดียวกันจะแสดงแนวโน้มขึ้นหรือลง สำหรับกรอบ 1 นาที ปริมาณซื้อขายของแท่งที่ปิดต้องสูงอย่างน้อย 1.25 เท่าของค่าเฉลี่ย 20 แท่งก่อนหน้า กรณีอื่นแสดงเป็นกลางEMA 20 vs EMA 50, RSI above 55 or below 45, and the MACD histogram above or below zero each cast one bullish or bearish vote. Two aligned votes indicate a bullish or bearish trend. On the 1-minute timeframe, the closed candle must also have at least 1.25 times the average volume of the preceding 20 candles. Otherwise the trend is neutral.
อัตราตรงทิศ = ถูก ÷ (ถูก + ผิด) ผลเสมอแสดงแยกAccuracy = correct ÷ (correct + wrong). Ties are shown separately.
เวอร์ชันสัญญาณ 1.2.0 · ดูประวัติอัปเดตSignals v1.2.0 · Release notes
- 1.2.0 เพิ่มตัวกรอง RVOL 1.25 เท่าเฉพาะกรอบ 1 นาทีAdded the 1.25× RVOL filter for the 1-minute timeframe.
- 1.1.0 เพิ่มผลจำลองย้อนหลัง 20 สัญญาณต่อกรอบกราฟAdded the last 20 simulated results per timeframe.
- 1.0.0 เปิดตารางแนวโน้ม 7 กรอบด้วย EMA, RSI และ MACDLaunched seven chart timeframes using EMA, RSI and MACD.
ดัชนีตลาดเอนข้าง BTCBTC positioning imbalance
ทฤษฎีผลประโยชน์คนส่วนน้อย · BTCUSDT Perpetual · กรอบ 1 ชั่วโมงMinority Interest Theory · BTCUSDT Perpetual · 1-hour timeframe
กำลังโหลดข้อมูลตลาด…Loading market data…
ราคาปิด BTC (USDT)BTC close (USDT)
สัดส่วนบัญชี Long (%)Long accounts (%)
เปรียบเทียบผลย้อนหลัง 4 และ 24 ชั่วโมงCompare historical 4- and 24-hour outcomes
ดัชนีนี้วัดอะไรHow this indicator works
กราฟแสดง 7 วันล่าสุด วัดความหนาแน่นเทียบกับ 7 วันก่อนแต่ละจุด Long หนาแน่นเมื่อ Long เกินครึ่งและสูงกว่าเปอร์เซ็นไทล์ที่ 90 ของช่วงอ้างอิง Short หนาแน่นเมื่อ Short เกินครึ่งและสัดส่วน Long ต่ำกว่าเปอร์เซ็นไทล์ที่ 10 จากนั้นเทียบกับราคาปิดชั่วโมงก่อน โดยเริ่มนับเหตุการณ์เมื่อสถานะเปลี่ยน ผลหลังเหตุการณ์วัดจากราคาปิดเทียบกับราคาตอนเกิดเหตุการณ์ ข้อมูลเป็นสัดส่วนบัญชีใน Binance Global และผลย้อนหลังใช้เพื่อศึกษาพฤติกรรมตลาดThe chart shows the latest 7 days. Each hour is compared against its preceding 7 days. Long is crowded when Long accounts exceed half and their share exceeds the prior 90th percentile. Short is crowded when Short exceeds half and the Long share is below the prior 10th percentile. The price is compared with the prior close. Events are counted when the state changes. Forward returns compare the later close with the event close. Account shares are specific to Binance Global. Historical outcomes describe market behavior.
ความสนใจบิทคอยน์ในไทยBitcoin search interest in Thailand
คำค้น Bitcoin · ประเทศไทย · ย้อนหลัง 90 วันSearch term Bitcoin · Thailand · Last 90 days
ภาพข้อมูล ณ 21 พ.ย. 2569 · ดูข้อมูลล่าสุดจากลิงก์ด้านล่างSnapshot as of 21 Nov 2026 · Latest data at the link below
คะแนน 0–100 คือความสนใจสัมพัทธ์ โดย 100 คือจุดสูงสุดในช่วงที่เลือกThe 0–100 score measures relative search interest. 100 is the peak in the selected period.
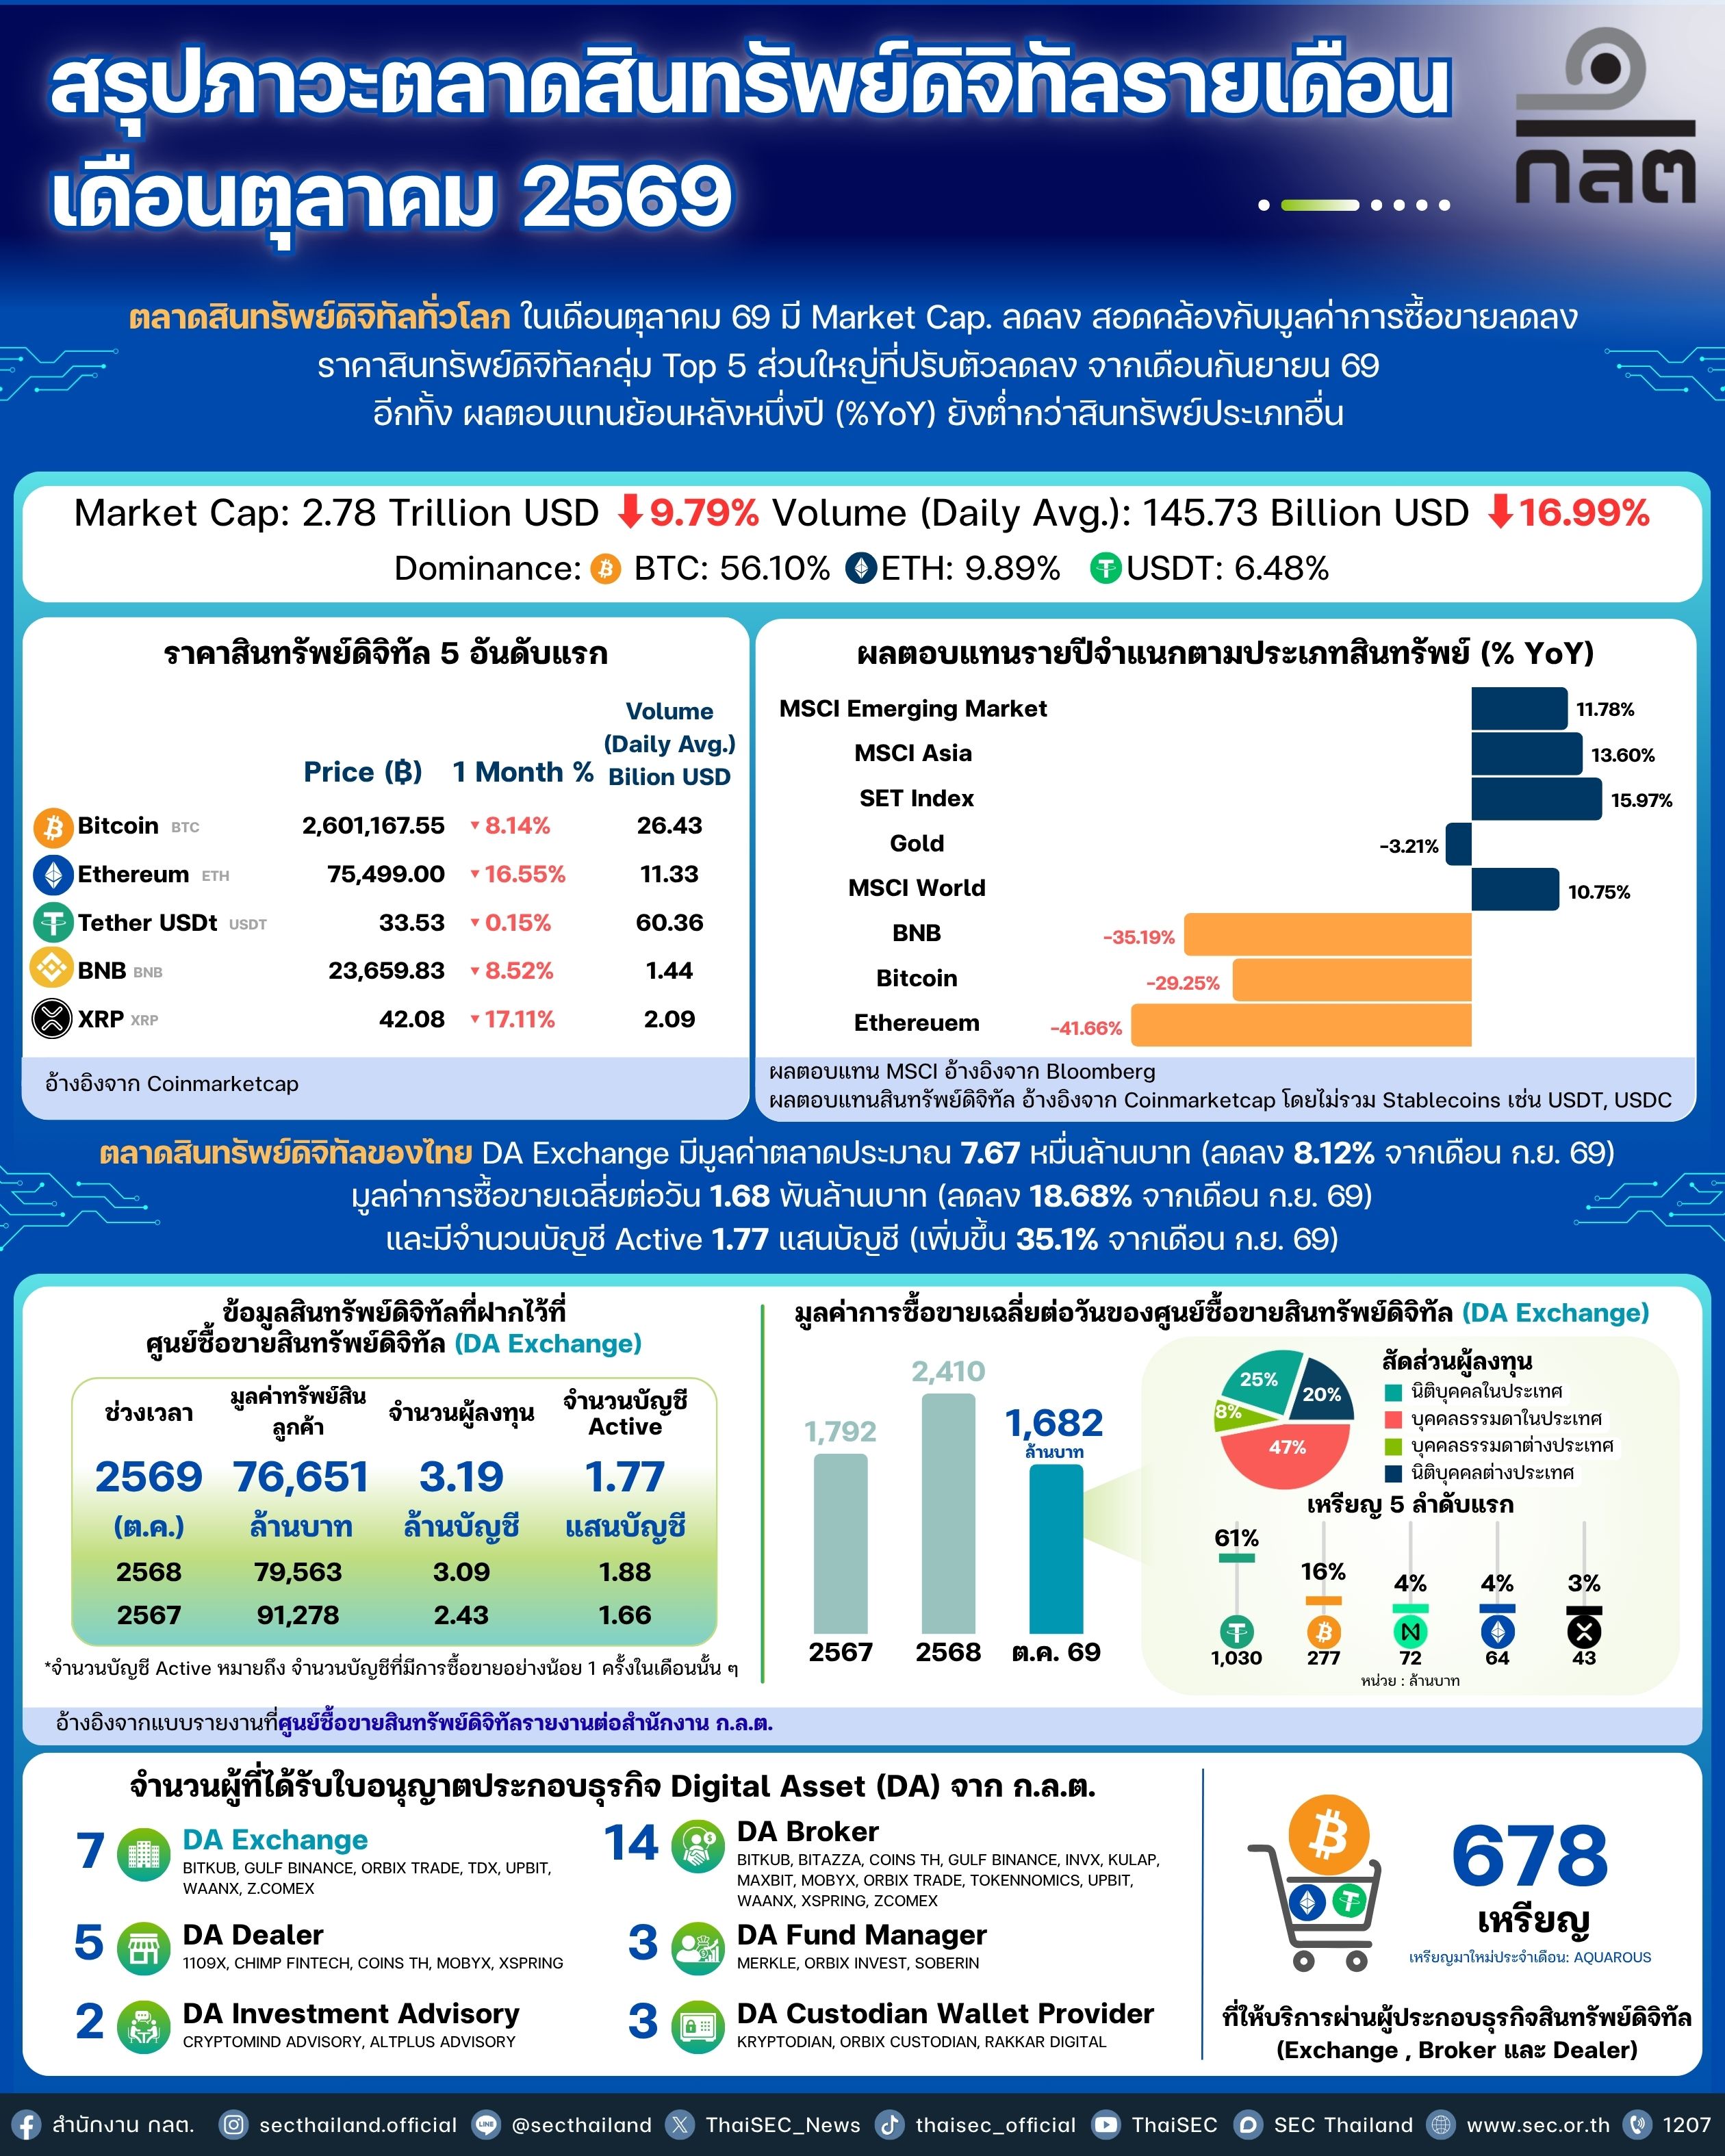
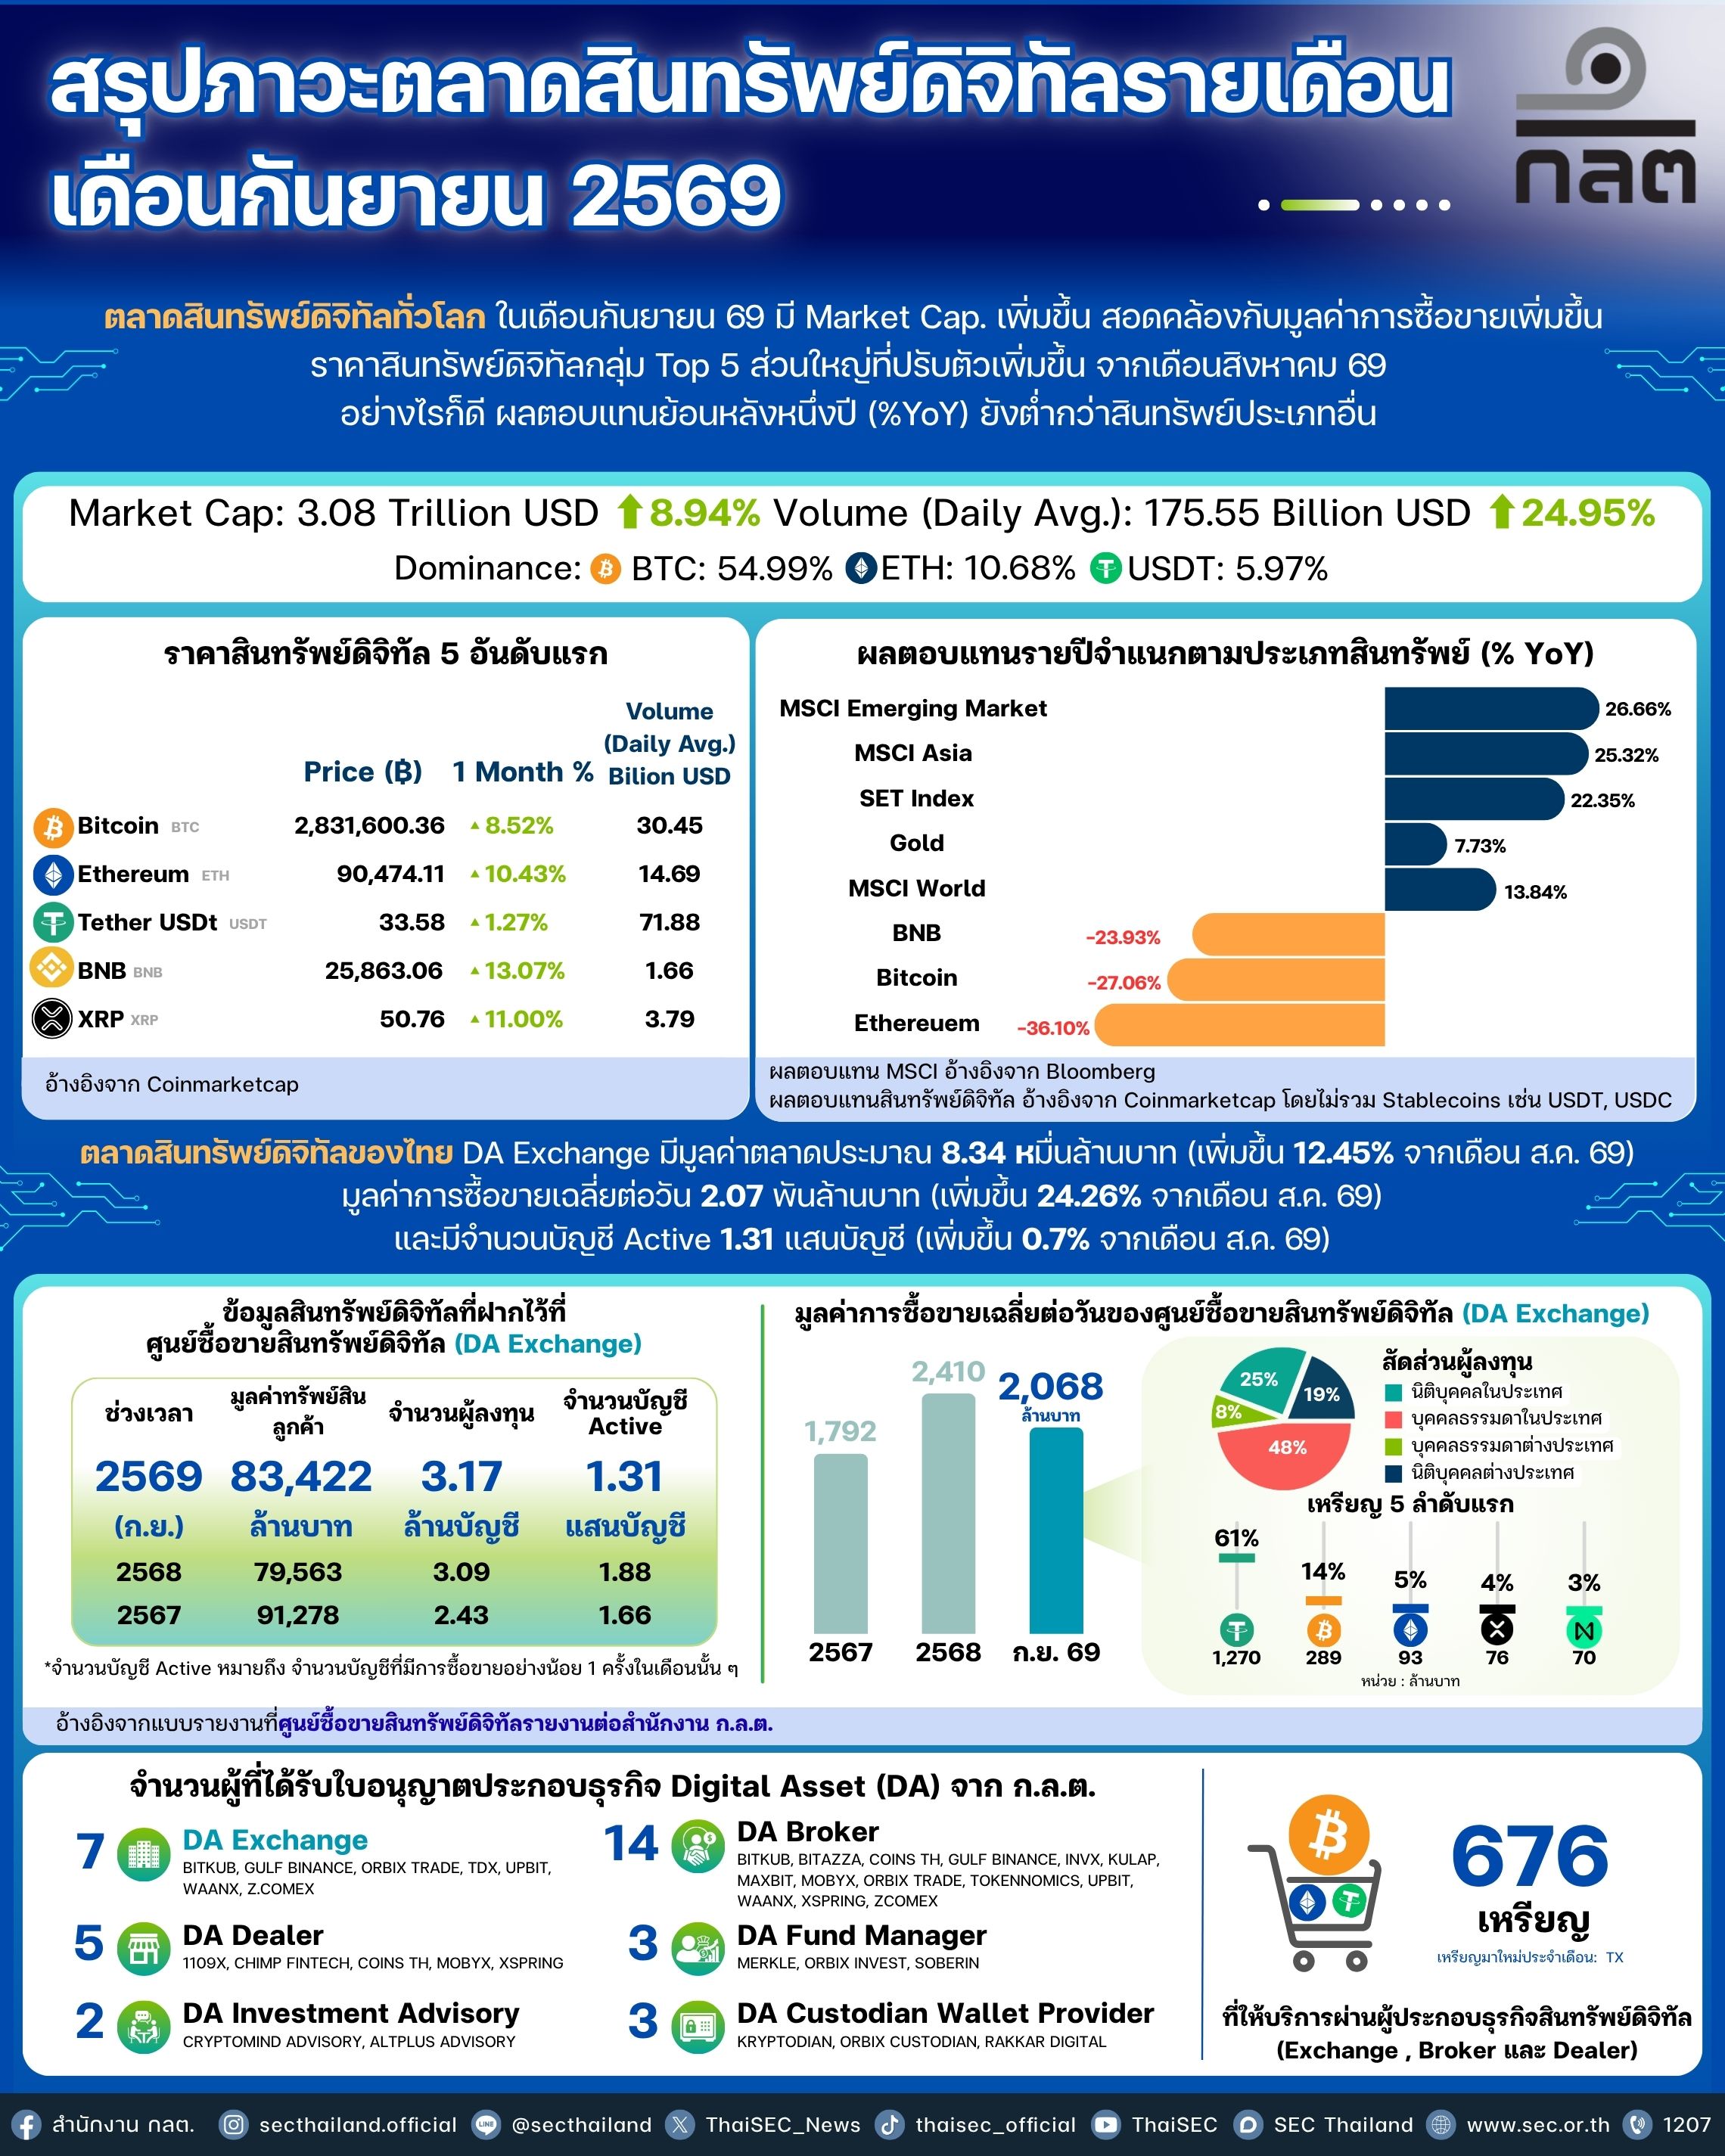
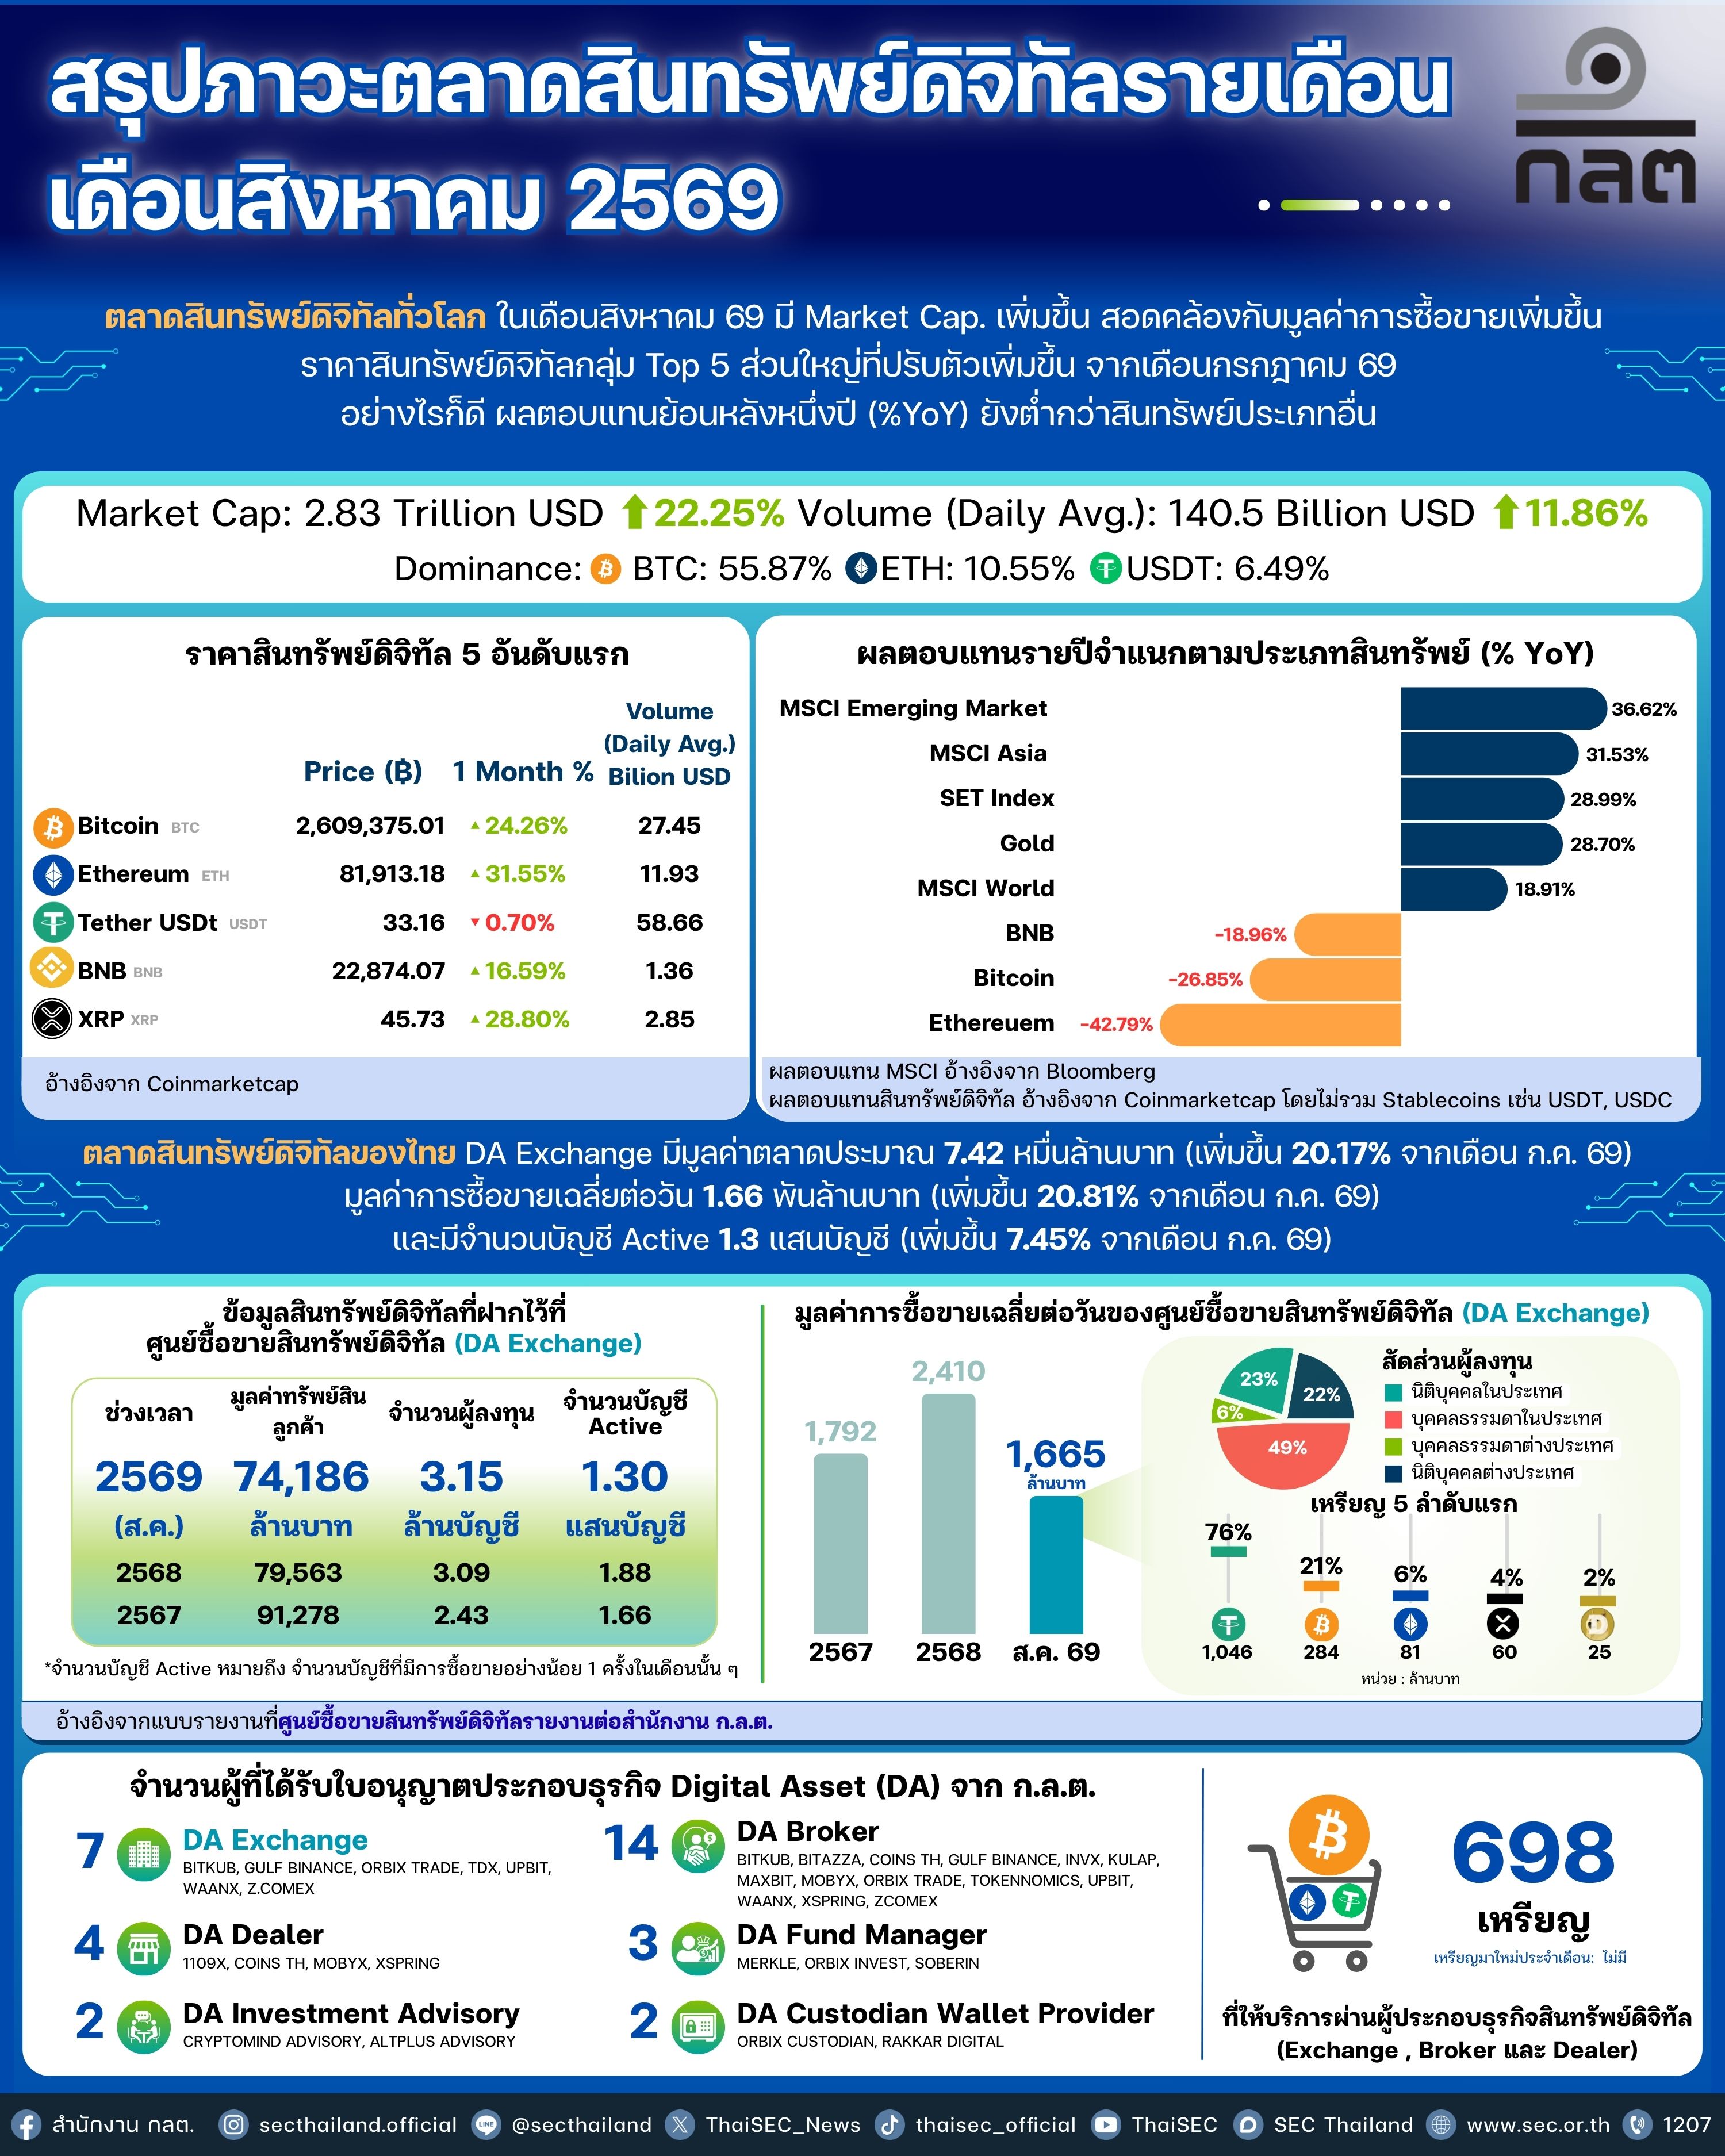
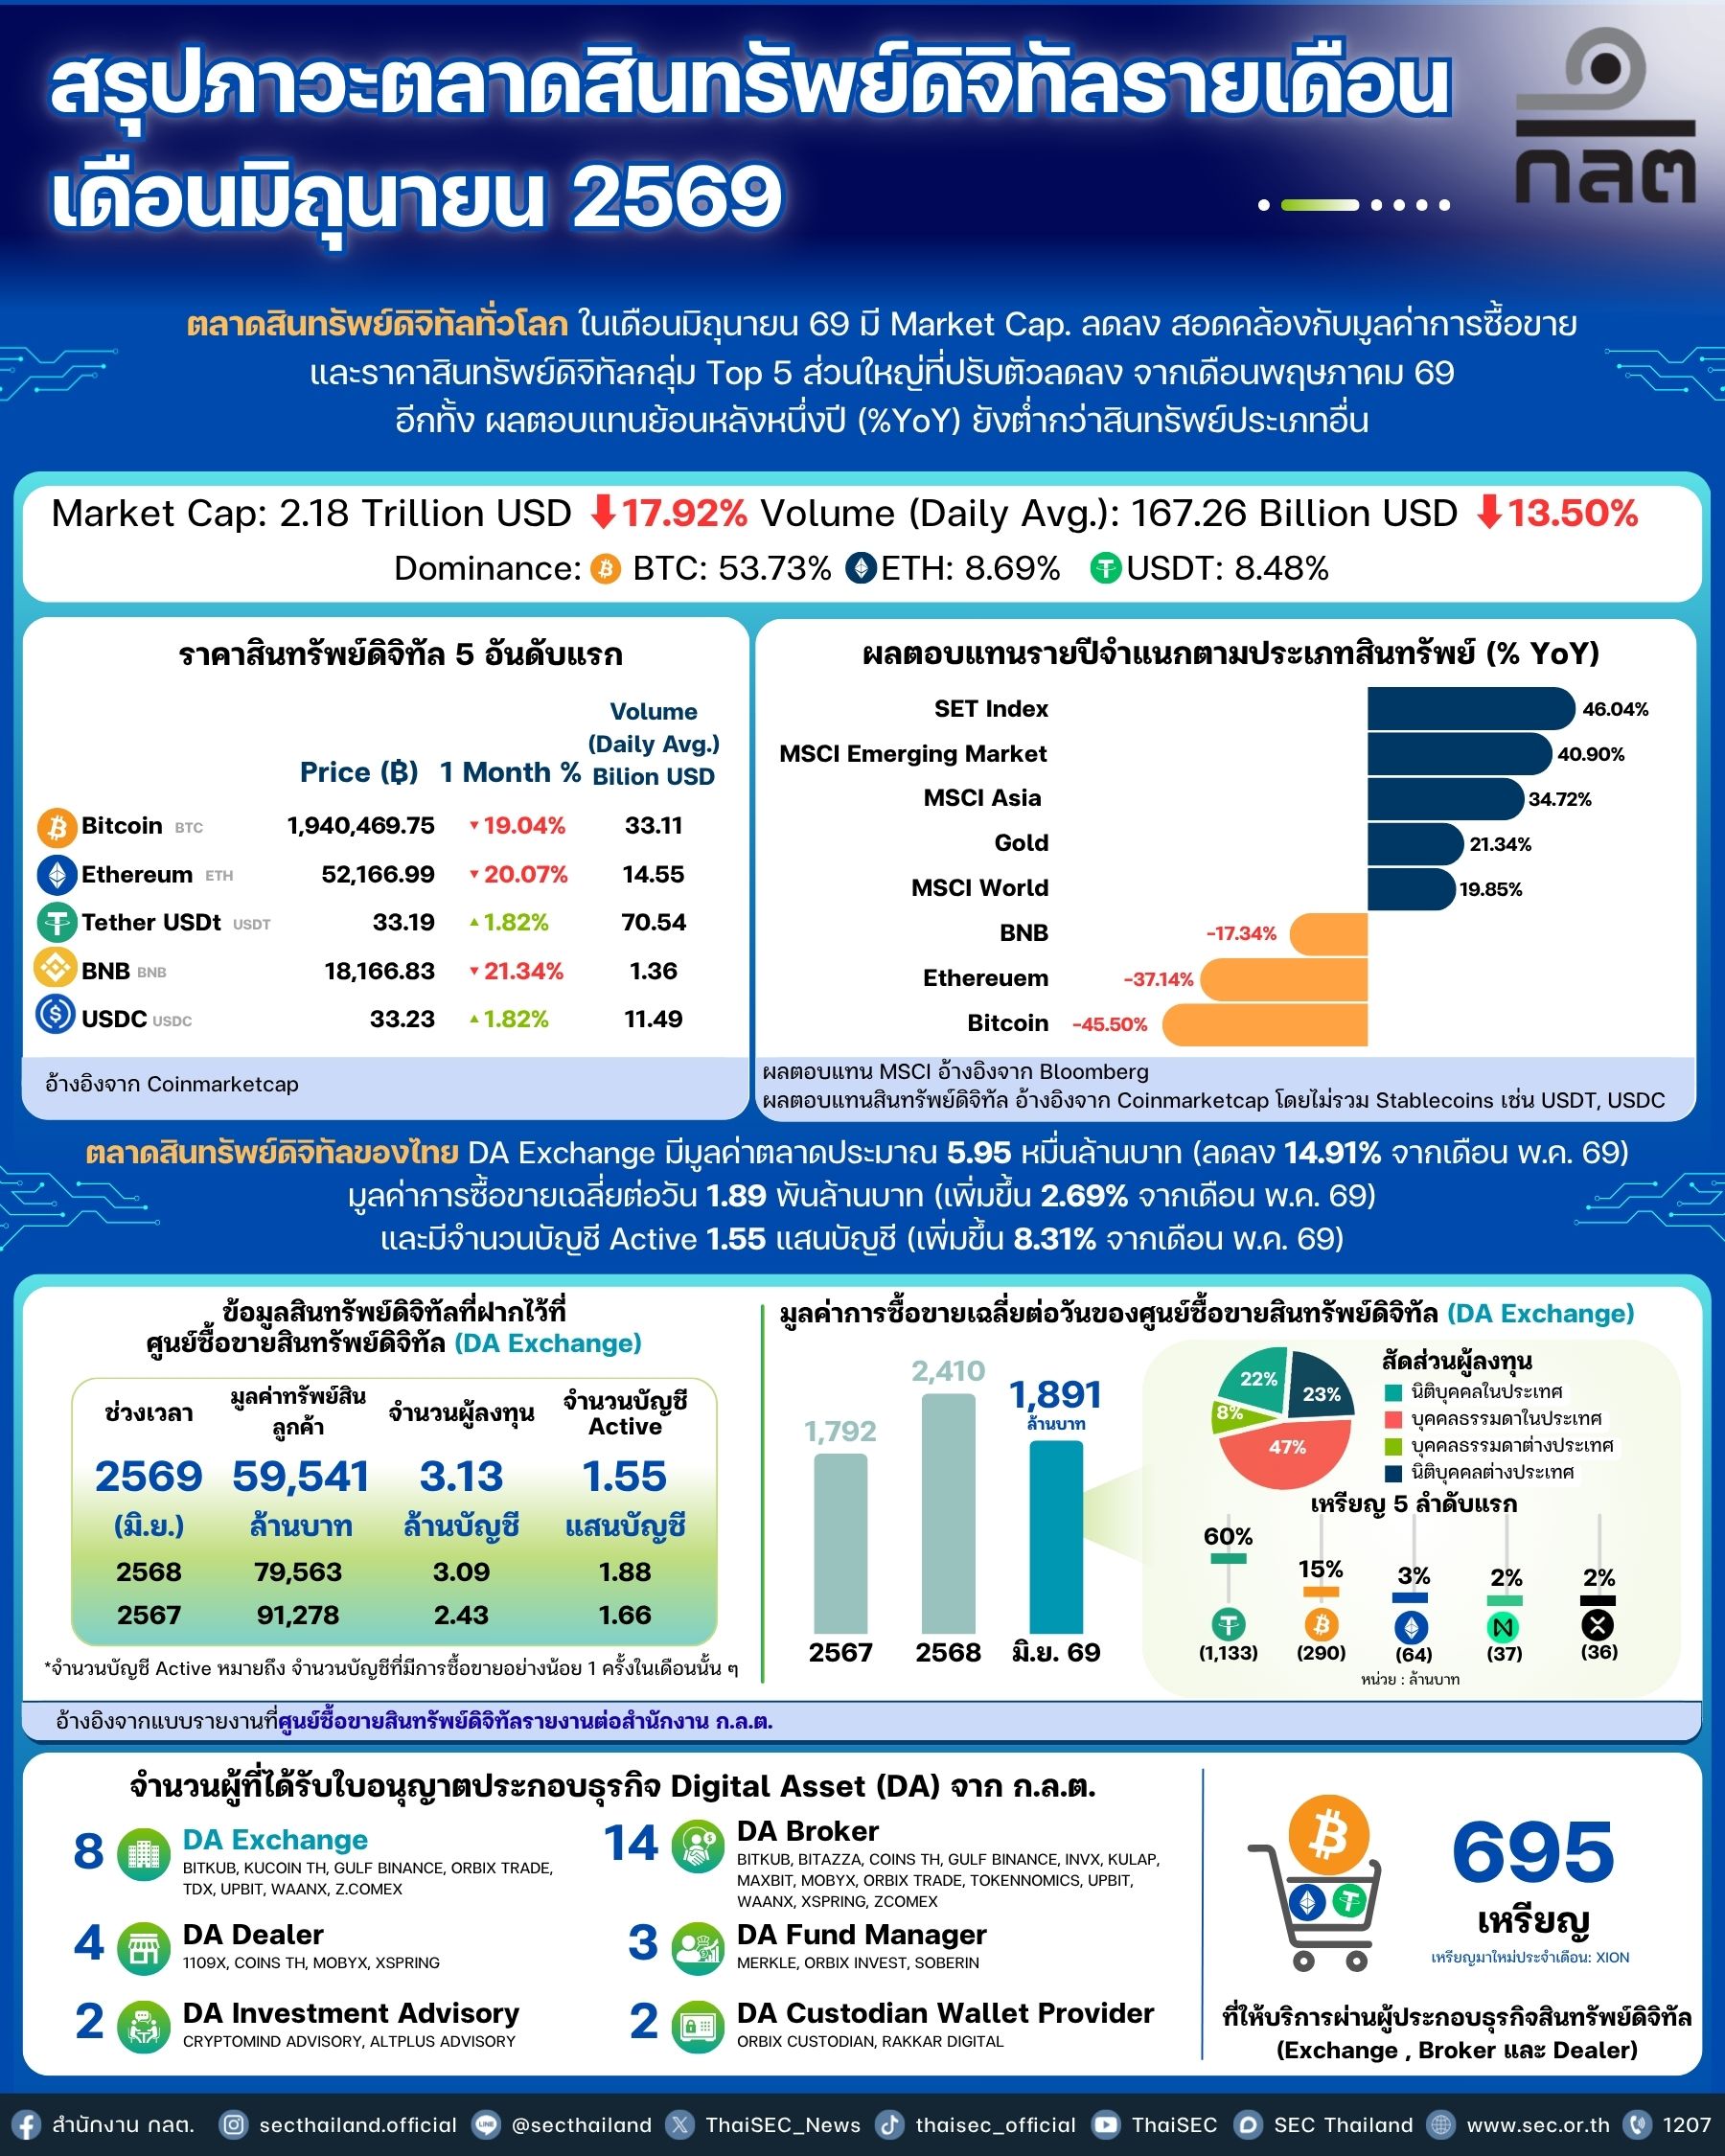
ดูข้อมูลใน Google TrendsView on Google Trendsบัญชีซื้อขายคริปโตในไทยActive crypto trading accounts in Thailand
บัญชี Active รายเดือน · พ.ย. 2568 – ต.ค. 2569Monthly active accounts · Nov 2025 – Oct 2026
≈ 177,000 บัญชีaccounts
ต.ค. 2569 · เพิ่มขึ้น 35.1% จากเดือนก่อน ตามรายงาน ก.ล.ต.Oct 2026 · Up 35.1% from the previous month, as reported by the SEC
บัญชี Active คือบัญชีที่ซื้อขายอย่างน้อย 1 ครั้งในเดือนนั้นบนศูนย์ซื้อขายสินทรัพย์ดิจิทัล หน่วยเป็นบัญชี ผู้ลงทุนหนึ่งคนอาจมีหลายบัญชีAn active account traded at least once during the month on a digital asset exchange. One investor may have more than one account.
ดูตัวเลขและรายงานรายเดือนView monthly figures and reports
| เดือนMonth | บัญชี Active (ประมาณ)Active accounts (approx.) |
|---|---|
| ต.ค. 2569Oct 2026 | 177,000 |
| ก.ย. 2569Sep 2026 | 131,000 |
| ส.ค. 2569Aug 2026 | 130,000 |
| ก.ค. 2569Jul 2026 | 121,000 |
| มิ.ย. 2569Jun 2026 | 155,000 |
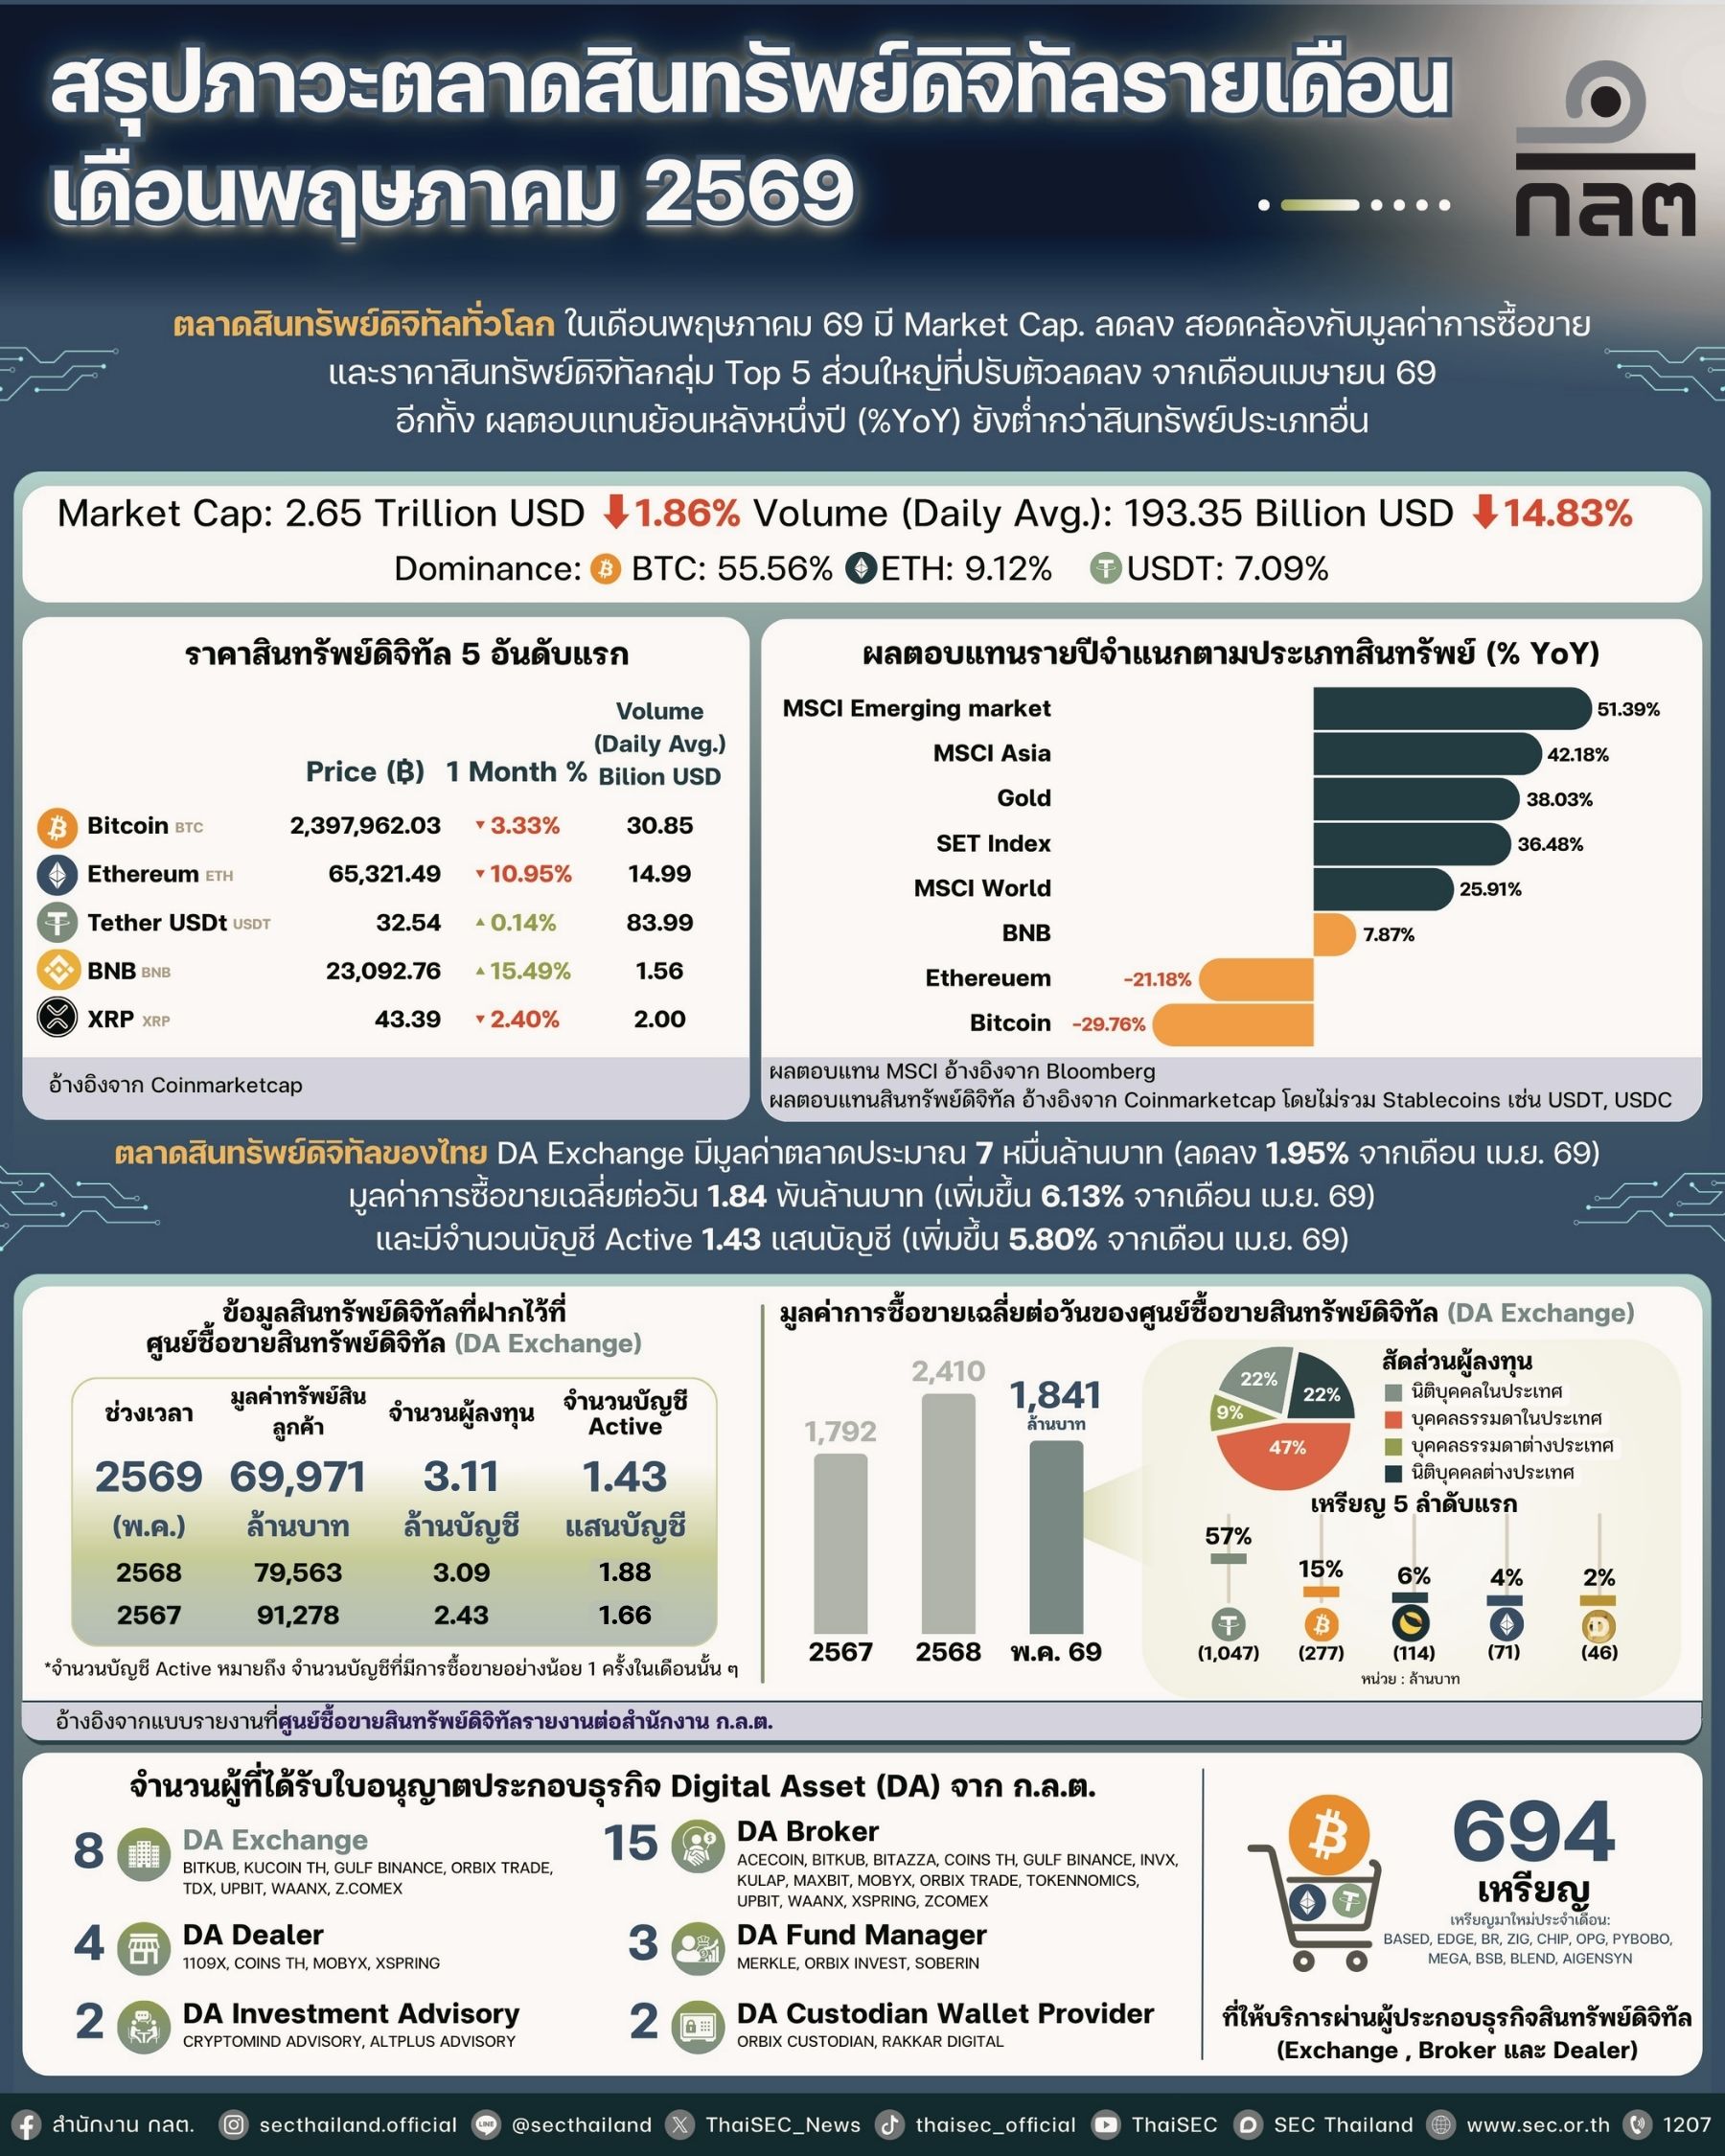
| พ.ค. 2569May 2026 | 143,000 |
| เม.ย. 2569Apr 2026 | 135,000 |
| มี.ค. 2569Mar 2026 | 146,000 |
| ก.พ. 2569Feb 2026 | 55,000 |
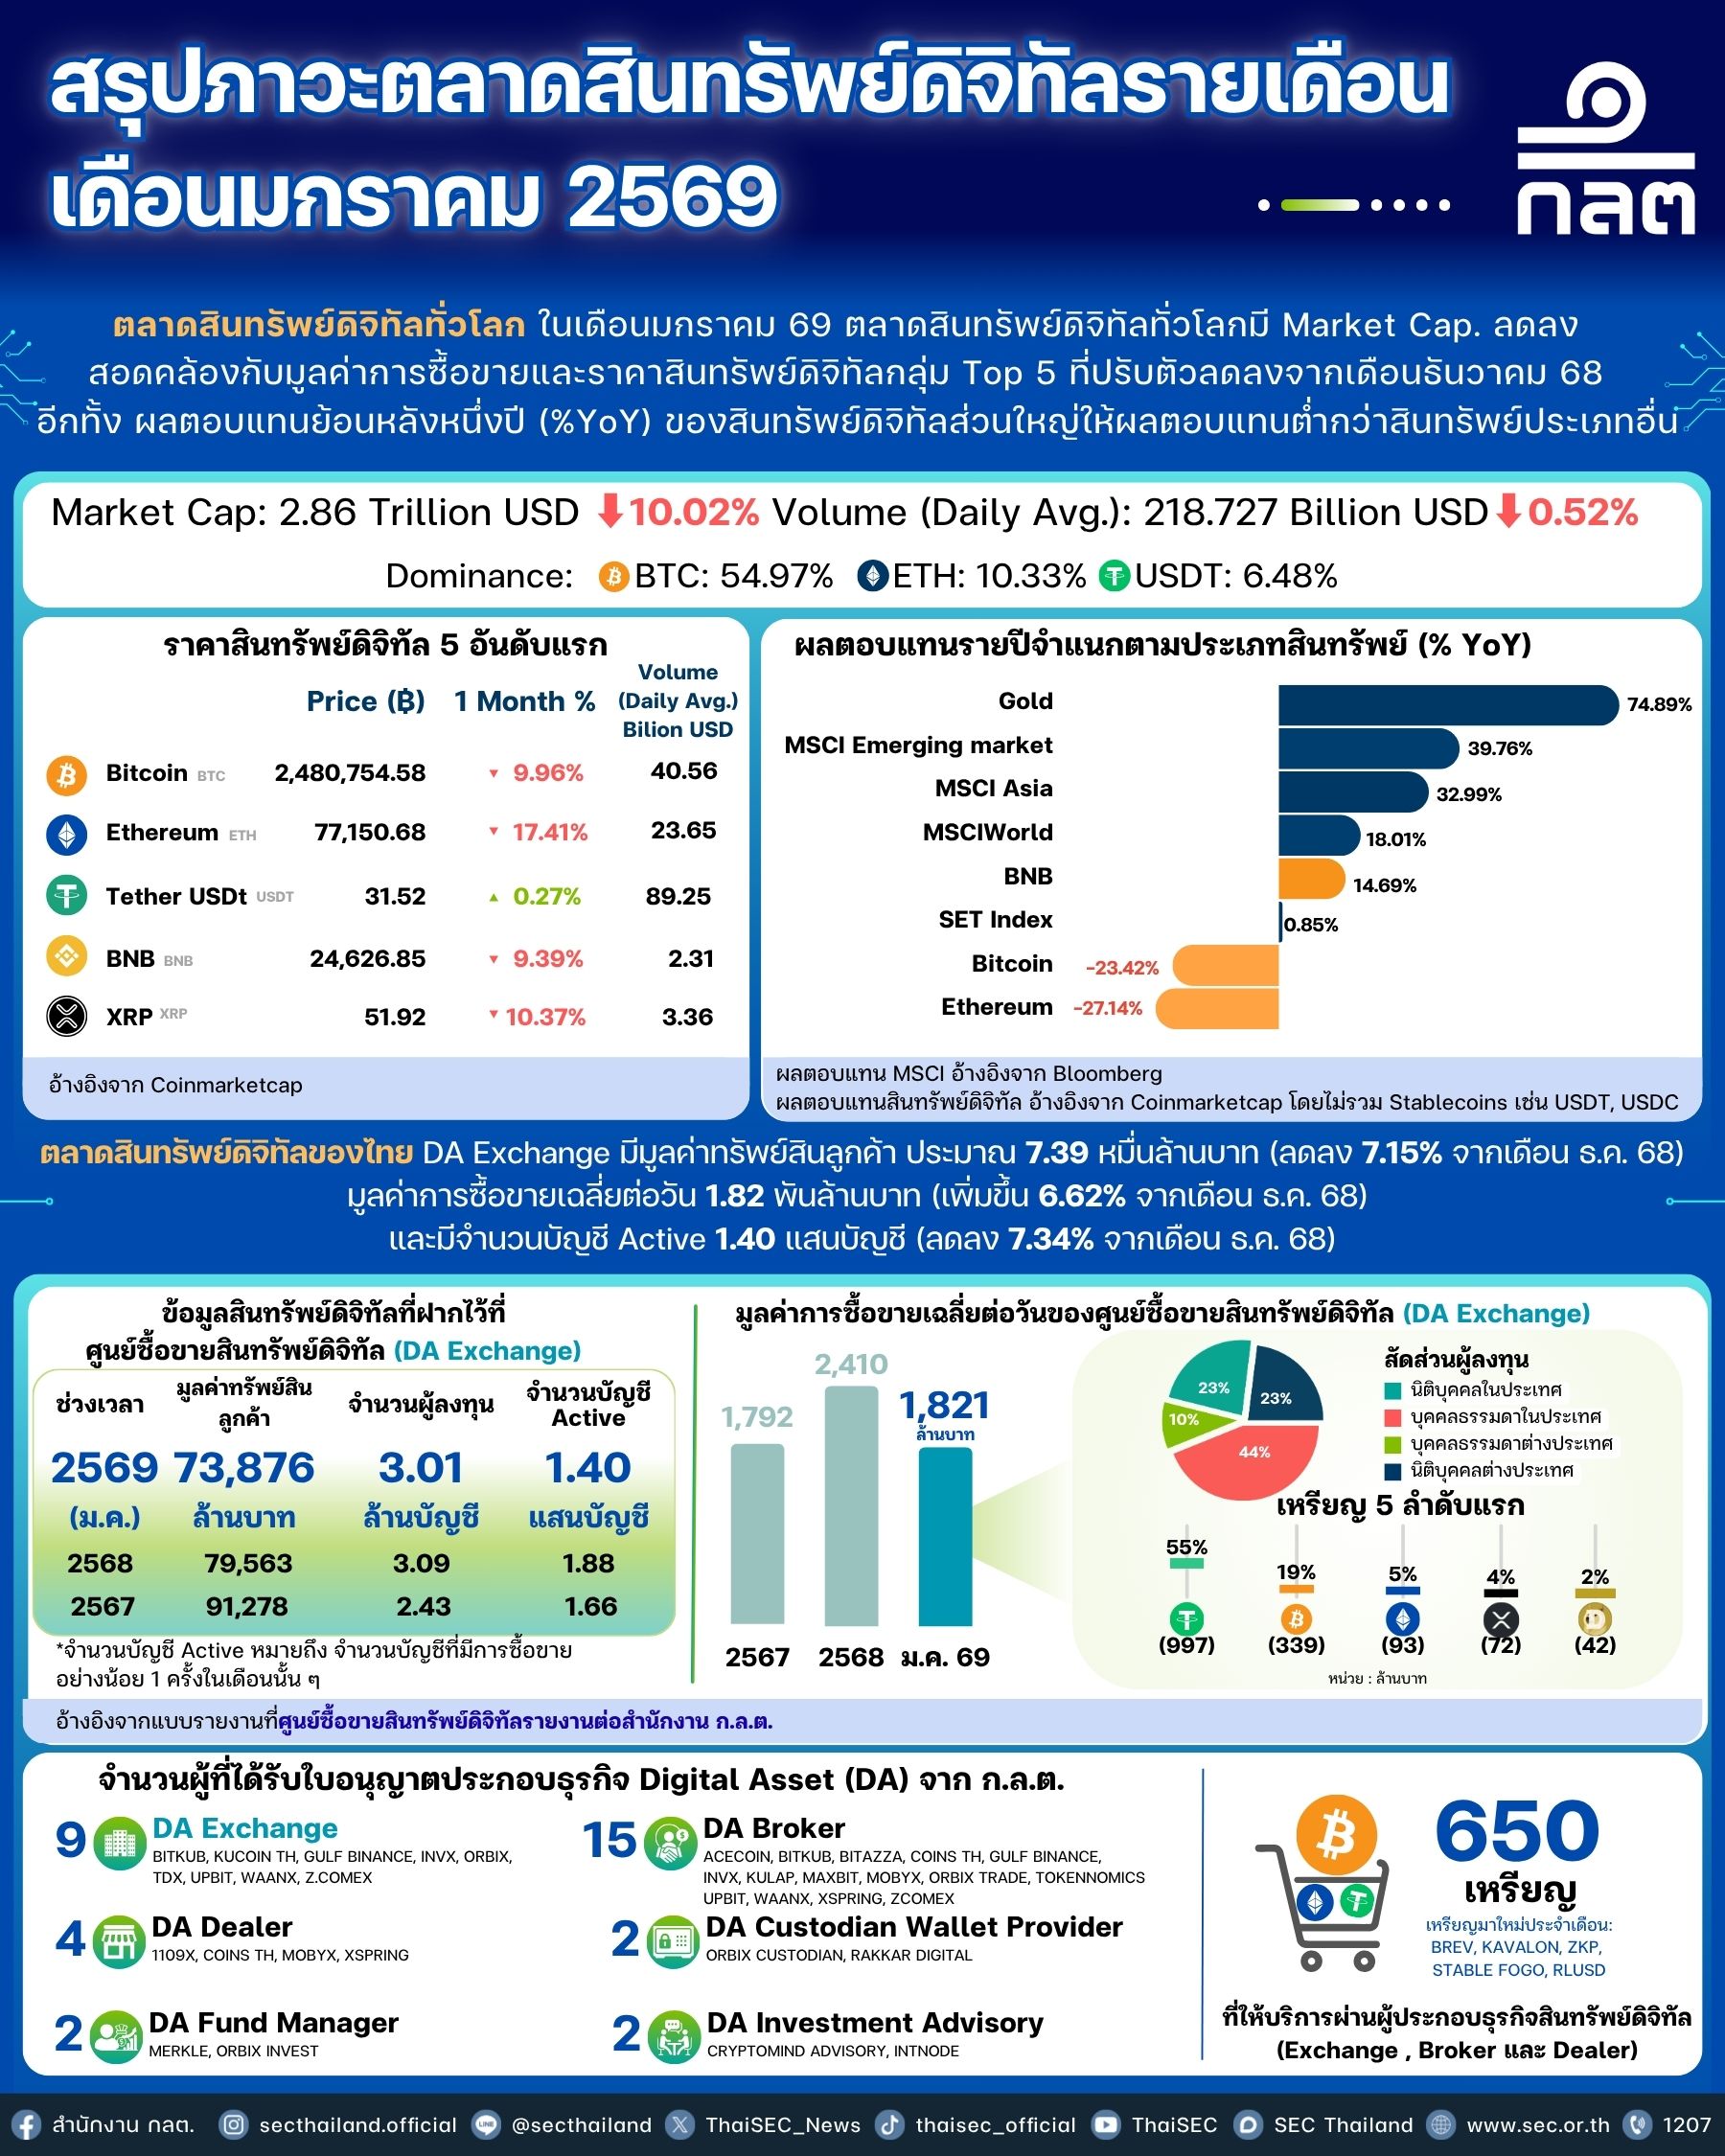
| ม.ค. 2569Jan 2026 | 140,000 |
| ธ.ค. 2568Dec 2025 | 151,000 |
| พ.ย. 2568Nov 2025 | 208,000 |





1 บิทคอยน์เท่ากับกี่บาทไทย?
ช่องคำนวณด้านบนเริ่มที่ 1 BTC และใช้ราคาเสนอขาย BTC/THB ต่ำสุดจากกระดานที่ส่งข้อมูลในรอบล่าสุด ก่อนค่าธรรมเนียม หากต้องการทราบว่า 0.01 BTC มีมูลค่ากี่บาท ให้กรอก 0.01 ระบบจะคูณจำนวน BTC ด้วยราคาอ้างอิงต่อเหรียญและแสดงผลทันที
ราคาซื้อและราคาขาย BTC ต่างกันอย่างไร?
ฝั่งซื้อแสดงราคาที่มีคนตั้งขายต่ำสุด (Ask) ฝั่งขายแสดงราคาที่มีคนตั้งซื้อสูงสุด (Bid) ของแต่ละกระดาน ราคาที่แสดงเป็นบาทต่อ 1 BTC ก่อนค่าธรรมเนียม ราคาที่ซื้อขายได้จริงขึ้นอยู่กับปริมาณที่มีในกระดานขณะส่งคำสั่ง
ราคาบิทคอยน์ล่าสุดอัปเดตเมื่อไร?
หน้าเว็บตรวจราคาใหม่ประมาณทุก 30 วินาทีและแสดงเวลาอัปเดตตามเวลาไทย หากกระดานใดส่งข้อมูลราคาไม่ได้ ระบบจะแจ้งที่การ์ดของกระดานนั้นและพักการจัดอันดับราคาของกระดานนั้น